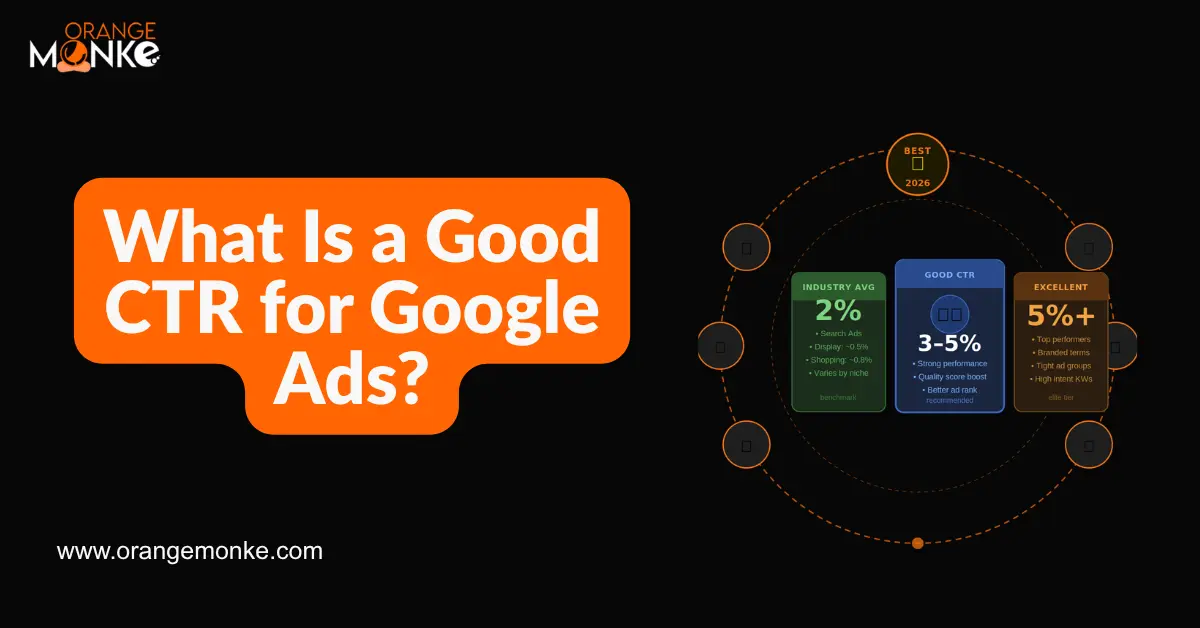
A good CTR for Google Ads in 2026 is anything above the 6.64% overall search average, but your real target is your own industry benchmark.
- Search (overall): above 6.64% is good, 10%+ is excellent.
- Branded search: 20% or higher.
- Non-branded search: above 5%.
- Display network: 0.5% to 1%.
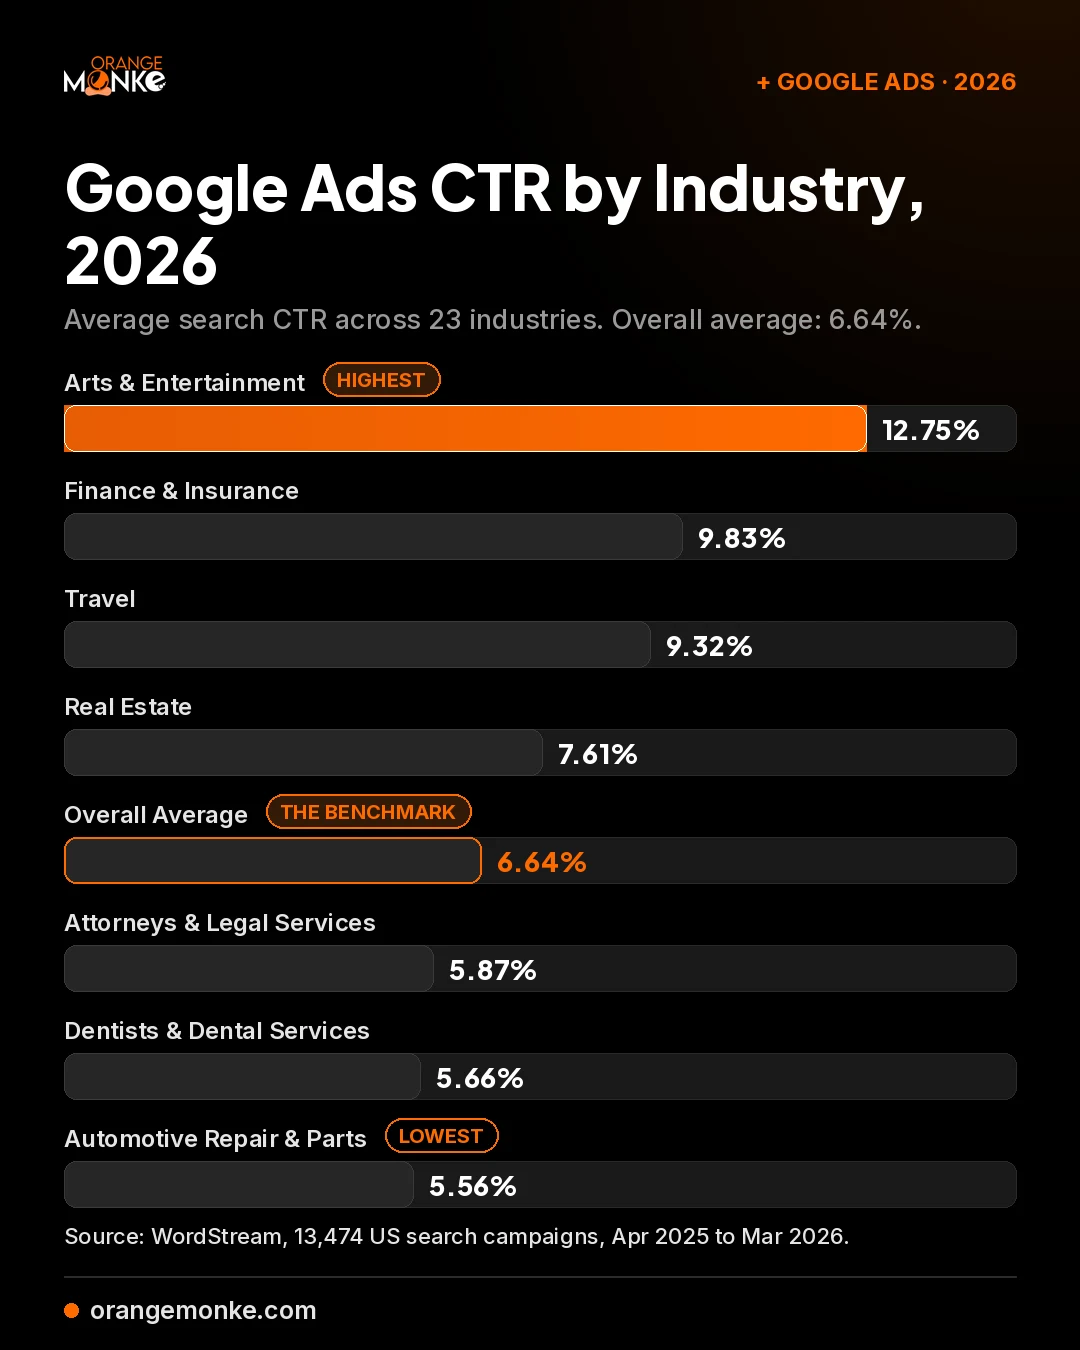
- Industry swing: Arts & Entertainment averages 12.75%, Automotive Repair 5.56%, so context beats any single number.
CTR is a leading indicator of ad relevance, a direct input into Quality Score, and one of the fastest signals that a campaign is working or quietly bleeding budget. Some advertisers obsess over it, others ignore it, and neither approach is right.
Asking "what is a good CTR for Google Ads?" (or Google AdWords, as long-time advertisers still call it) is the right question, but only the first one. A "normal" CTR does not exist in isolation: the real benchmark depends on your industry, campaign type, bid strategy, and goals.
This guide covers all of it: the latest 2026 benchmarks across 23 industries, a breakdown by campaign type (Search, Shopping, Performance Max, Display, YouTube), branded vs non-branded CTR, expected CTR, and a practical playbook for lifting your click-through rate without burning budget.
What Is Google Ads CTR?
Google Ads CTR (click-through rate) is the percentage of ad impressions that result in a click. It tells you, out of every 100 people who see your ad, how many actually click through to your landing page.
In Google Ads, CTR shows up at every level of your account: campaign, ad group, keyword, and individual ad. Google uses it as one of the strongest signals of ad quality. A high CTR tells Google that your ad is relevant to the search query. A low CTR tells Google the opposite, and the platform responds by lowering your Quality Score and raising your cost per click.
CTR matters for three reasons:
- It is the gateway to every other metric. No clicks means no traffic, no leads, and no revenue. Conversion rate, cost per lead, and ROAS all start with a click.
- It is a direct input into Quality Score. Google's "expected CTR" is one of three factors (along with ad relevance and landing page experience) that determine Quality Score, which controls how much you pay per click and where your ad ranks.
- It is a fast feedback loop. You can read CTR within hours of launching a campaign, long before you have enough conversions to judge ROI. That makes it the first lever most experienced PPC managers pull when optimising a new account.
How to Calculate CTR for Google Ads
The Google Ads CTR formula divides clicks by impressions and multiplies by 100, giving you the percentage of ad views that turned into visits.
For example, if your ad was shown 20,000 times and received 1,000 clicks, your CTR is:
(1,000 ÷ 20,000) × 100 = 5%
Google calculates this automatically inside the Google Ads interface, so you do not need to do the math manually. But understanding the formula matters because it explains why CTR moves the way it does. When impressions grow faster than clicks (for example, when broad match expands your reach to less relevant queries), CTR falls. When you tighten your targeting, impressions drop but clicks stay relatively stable, and CTR climbs.
Where Do You Find Your Google Ads CTR?
Your Google Ads CTR lives in the CTR column of the Campaigns, Ad groups, Ads, and Keywords views, shown by default in most accounts. To pull it up:
- Open Campaigns, Ad groups, Ads, or Keywords from the left navigation
- The CTR column appears by default in most views
- For deeper analysis, segment by device, network, time, or geography to spot where CTR is strong or weak
What Is a Good CTR for Google Ads in 2026?
A good CTR for Google Ads in 2026 is above 6.64%, the overall search advertising average across all industries, based on WordStream's study of more than 13,000 campaigns running between April 2025 and March 2026. Anything above the industry average for your sector is considered strong, and anything close to or above the top quartile is considered excellent.
Here is how CTR benchmarks stack up across the major ad surfaces in 2026:
| Ad Surface | Good CTR Benchmark (2026) | What "Excellent" Looks Like |
|---|---|---|
| Google Search (Overall) | 6.64% and above | 10%+ |
| Branded Search Campaigns | 20% and above | 30%+ |
| Non-Branded Search Campaigns | 5% and above | 10%+ |
| Google Shopping | 0.86% to 1% | 1.5%+ |
| Performance Max | 2% to 3% | 5%+ |
| Google Display Network | 0.5% to 1% | 1.5%+ |
| YouTube / Video Ads | 0.5% to 0.84% | 1%+ |
One benchmark per surface: clear 6.64% on search, 20% on branded, and treat anything near double your surface average as excellent.
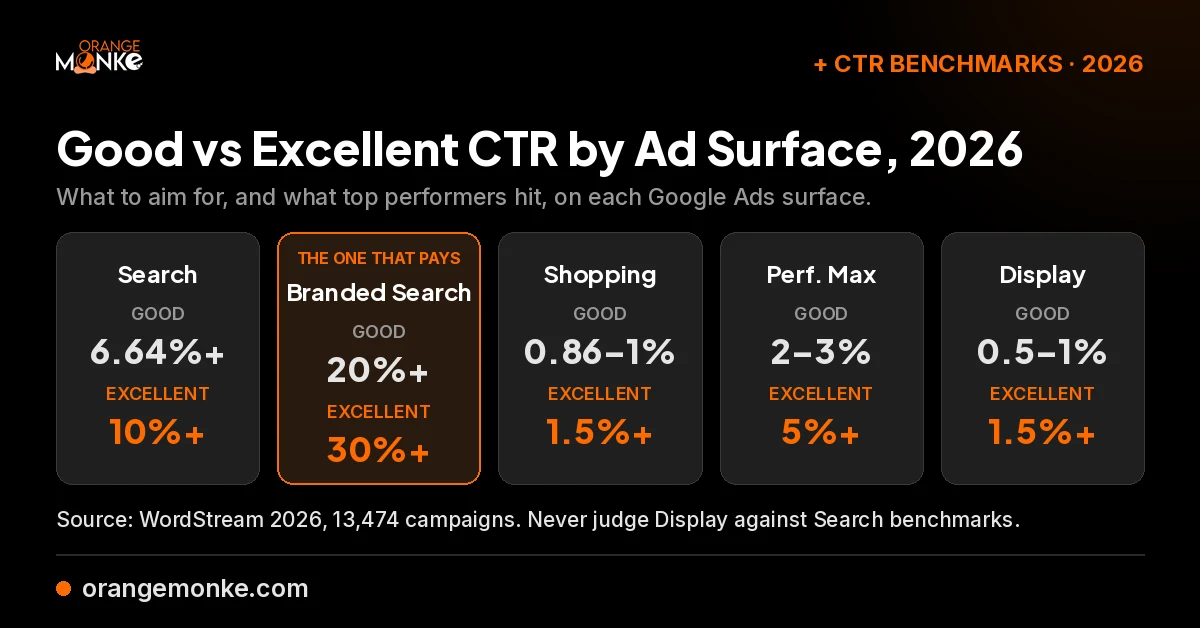
The CTR trends behind these numbers point one way: search averages have climbed over recent years as ad assets grew richer, while display has stayed flat year over year. Treat these as starting points, not gospel. The "good CTR" target for your account depends on the industry, the keyword's intent, the campaign type, the device, the geography, and the bid strategy. A 4% CTR on a non-branded Legal Services search campaign with a $9.87 average CPC is doing better than a 9% CTR on a YouTube branded display campaign. Context decides.
Average CTR for Google Ads by Industry (2026)
Industry is the single biggest variable in answering "what is a good CTR for Google Ads?". A 5.5% CTR is below average in Arts & Entertainment but right at the median in Dentistry. Here is the latest 2026 average CTR breakdown across all 23 tracked industries:
| Industry | Average CTR (2026) | Performance Tier |
|---|---|---|
| Arts & Entertainment | 12.75% | Highest |
| Finance & Insurance | 9.83% | Top Tier |
| Travel | 9.32% | Top Tier |
| Sports & Recreation | 8.75% | Top Tier |
| Automotive — For Sale | 8.28% | Above Average |
| Shopping, Collectibles & Gifts | 8.28% | Above Average |
| Real Estate | 7.61% | Above Average |
| Education & Instruction | 7.56% | Above Average |
| Animals & Pets | 7.49% | Above Average |
| Personal Services | 7.16% | Above Average |
| Restaurants & Food | 6.83% | Above Average |
| Beauty & Personal Care | 6.75% | Average |
| Overall Average (All Industries) | 6.64% | Benchmark |
| Apparel / Fashion & Jewelry | 6.64% | Average |
| Physicians & Surgeons | 6.61% | Average |
| Furniture | 6.57% | Average |
| Industrial & Commercial | 6.57% | Average |
| Home & Home Improvement | 6.47% | Average |
| Business Services | 6.10% | Below Average |
| Career & Employment | 5.88% | Below Average |
| Attorneys & Legal Services | 5.87% | Below Average |
| Health & Fitness | 5.81% | Below Average |
| Dentists & Dental Services | 5.66% | Below Average |
| Automotive — Repair, Service & Parts | 5.56% | Lowest |
The spread runs from 12.75% at the top to 5.56% at the bottom, so compare yourself against your own row, never the overall average alone.
Source: WordStream 2026 Google Ads benchmarks, based on 13,474 US-based search advertising campaigns running April 2025 to March 2026. Running paid social alongside search? Our Facebook Ads CTR benchmarks break down CPC, CPM, CTR, and ROAS by industry the same way.
Why Does CTR Vary So Much Across Industries?
CTR varies across industries because search intent strength, SERP competition, and brand familiarity differ by category, and those three factors explain almost all the spread:
- Search intent strength. Travel, Arts & Entertainment, and Sports searches usually carry strong, immediate intent: people want to book, buy a ticket, or watch a game. That intent converts into clicks. Service industries like Legal or Dental have more "research first" intent, with users comparing providers across many touchpoints.
- SERP layout and competition. In high-CPC categories like Legal Services ($9.87 average CPC) and Dental ($8.00 average CPC), more advertisers compete for fewer ad slots, the ads look more similar to each other, and CTR gets diluted across competitors.
- Brand familiarity. Categories with strong consumer brands (Apparel, Beauty, Travel) get high branded-search CTR, and that lifts the industry average. B2B and professional services lean more non-branded, which pulls averages down.
If your industry sits in the "below average" tier, do not panic. A 5.8% CTR in Legal Services is normal. Compare yourself against your industry, not the universal 6.64% average.
Note: these are paid ads benchmarks. SEO CTR benchmarks work differently: organic CTR falls sharply by ranking position (Google CTR per ranking drops from double digits at position 1 to low single digits by position 5), and we cover organic CTR by position in a dedicated guide.
What Is a Good CTR by Campaign Type?
Different Google Ads campaign types serve different roles, target different intent, and naturally produce very different CTRs. Comparing a Search CTR to a Display CTR is comparing apples to oranges: the user behaviour behind each impression is completely different.
Search Campaigns (Highest CTR)
Search campaigns run on Google's search results pages, where users are actively typing in queries with clear intent. Because the user is searching with purpose, Search ads consistently deliver the highest CTRs across all campaign types. A good CTR for a non-branded Search campaign is 5% or higher; for branded Search, it is 20% or higher.
What Is a Good CTR for Google Shopping Ads?
A good CTR for Google Shopping ads is 0.86% to 1%, and anything above 1% is strong. Shopping ads appear in the product carousel at the top of Google search results and in the dedicated Shopping tab. Because users see multiple product tiles at once and choose based on image and price, CTRs look smaller in absolute terms, but the intent quality is comparable to Search. Feed quality and price competitiveness drive Shopping CTR more than ad copy does, which is why e-commerce PPC management centres on the product feed.
Performance Max (Medium CTR, Broad Reach)
Performance Max (PMax) campaigns run across every Google surface (Search, Shopping, Display, YouTube, Gmail, Maps, and Discover), driven by Google's AI. Because PMax mixes high-intent placements with passive ones, the average CTR usually lands between Search and Display. A good PMax CTR benchmark is 2% to 3%, with top performers exceeding 5%. Ads on Google Maps and local placements also run through PMax and local campaigns, so their clicks land in the same blended CTR. Watch conversion value, not CTR alone, when judging PMax.
Display Campaigns (Lowest CTR)
Display ads show across Google's partner network of millions of websites and apps. Users are not searching; they are reading, watching, or browsing. Intent is passive, so CTRs are dramatically lower. A good CTR on the Google Display Network is anything between 0.5% and 1%. Anything above 1% is excellent for display.
YouTube and Video Campaigns
YouTube ads measure CTR differently depending on the ad format (TrueView, in-stream, bumper, etc.). Across formats, a good CTR is 0.5% to 0.84%. View rate, view-through conversions, and watch time matter more than raw CTR for video.
What Is a Good CTR for Search Ads?
For Google Search ads specifically, "good" depends on whether the campaign targets branded or non-branded keywords, the position your ad earns, and how strong your Quality Score is.
The shortcut benchmarks:
- Non-branded Search campaigns: 5% CTR is the floor. Above 7% is good. Above 10% is excellent.
- Branded Search campaigns: 20% CTR is the floor. Above 30% is excellent.
- Mixed Search campaigns: Aim for the overall 2026 average of 6.64% as your minimum target.
Ad position also has a measurable effect. Industry research shows that ads in position 1 (top position) earn an average CTR of around 2.1% for paid placements, while ads in position 4 fall to around 1.1%. The further down the SERP your ad lands, the harder it has to work on copy, assets, and offer to maintain a strong CTR.
What Drives a Strong CTR on Search Ads?
- Tight match between your headline and the user's exact query
- A clear, differentiated value proposition in the first headline
- Strong use of all available assets: sitelinks, callouts, structured snippets, images, prices, promotions
- Ad position 1–3 on the SERP
- Quality Score of 7 or higher (target 8–10)
What Is a Good CTR for Display Ads?
A good CTR for Google Display Network ads is between 0.5% and 1%. The industry standard CTR for display ads (the overall network average) sits around 0.35% to 0.46%, which means anything at or above 0.5% is already beating the norm. Anything above 1% qualifies as a high CTR for display.
Display CTRs look low compared to Search for a simple reason: display ads are seen by users who are not searching for anything related to your product. They are reading an article, watching a video, or browsing an app, and your banner appears as a peripheral element on the page. Even a perfectly designed display ad is competing for attention against the content the user actually came to consume.
How Do You Push Display CTR Higher?
- Use responsive display ads with multiple headlines, descriptions, images, and logos so Google can optimise the combination per placement
- Tighten audience targeting: custom audiences, remarketing lists, and in-market segments outperform broad demographic targeting on display
- Refresh creative every 30 to 60 days to fight ad fatigue (creative fatigue alone can cut display CTR by 30%+ in a quarter)
- Exclude poor placements using the Placements report; apps and low-quality content sites quietly drain CTR
- Use strong contrast and a single clear CTA on banner creatives; cluttered banners always underperform
Branded vs. Non-Branded Google Ads CTR
The differences between branded and non-branded Google Ads CTR are dramatic: split them into separate buckets and the numbers tell two very different stories, and combining them into a single account-wide CTR usually hides what is really happening in your campaigns.
| Keyword Type | Definition | Good CTR Benchmark |
|---|---|---|
| Branded | Includes your company or product name (e.g. "Orange MonkE SEO services") | 20% – 30%+ |
| Non-Branded | Generic keywords describing what you sell (e.g. "SEO agency in Dubai") | 5% – 10%+ |
| Competitor | Names of rival brands you bid against | 3% – 7% |
Branded terms carry a 20%+ floor, non-branded a 5% floor, and competitor terms sit in between: report each bucket separately.
Branded CTR is high because intent is high. When someone searches for your brand name, they are already 80% of the way to the decision. Your ad is essentially a navigation shortcut, and a 20%+ CTR is the floor, not a stretch goal.
Non-branded CTR is lower because users are exploring. They are comparing several providers, evaluating offers, and may not even know your business exists. A 5% CTR on non-branded means your ad is breaking through the consideration noise.
Always segment branded and non-branded reporting. If your account-wide CTR is 12% and you assume that means everything is healthy, you may be missing that branded is doing all the work at 28% and non-branded is dragging at 3%. The fix lives in the segment that is underperforming, not in the blended average.
Why Google Ads CTR Matters for Your Bottom Line
CTR is not a vanity metric. It moves the three numbers that actually decide whether your campaign is profitable: Quality Score, cost per click, and ad rank.
1. CTR Drives Quality Score
Google's Quality Score is a 1–10 rating assigned to each keyword based on three components: expected CTR, ad relevance, and landing page experience. Expected CTR is the single biggest input. A high CTR signals to Google that your ad genuinely matches what users want, and your Quality Score goes up.
2. Higher Quality Score = Lower CPC
Quality Score directly affects what you pay per click. A keyword with a Quality Score of 10 pays significantly less per click than the same keyword at Quality Score 5, sometimes 50% less. Lifting your CTR can quietly cut your cost per click by double-digit percentages without changing your bid at all.
3. CTR Affects Ad Rank and Position
Ad rank decides where your ad shows on the SERP. The formula multiplies your bid by your Quality Score. So a high-CTR campaign with a strong Quality Score can outrank a competitor bidding more aggressively, meaning you pay less and appear higher.
4. CTR Predicts Campaign Health Early
You can read CTR within hours of launching a campaign, well before you accumulate enough conversion data to judge ROI. That makes it the fastest diagnostic in your account: a sudden CTR drop usually points to an ad assets issue, a competitor change, or a tracking break before any other metric flags the problem.
Improve your CTR by 30% (say, from 5% to 6.5%) and the second-order effects compound: Quality Score rises, CPC drops 10–20%, you can afford to bid into higher positions, ad rank improves, and impressions on relevant queries grow. The same budget now drives more clicks, often at a lower CPL. This is why experienced PPC managers obsess over CTR even when it is not their primary KPI.
What Is Expected CTR in Google Ads?
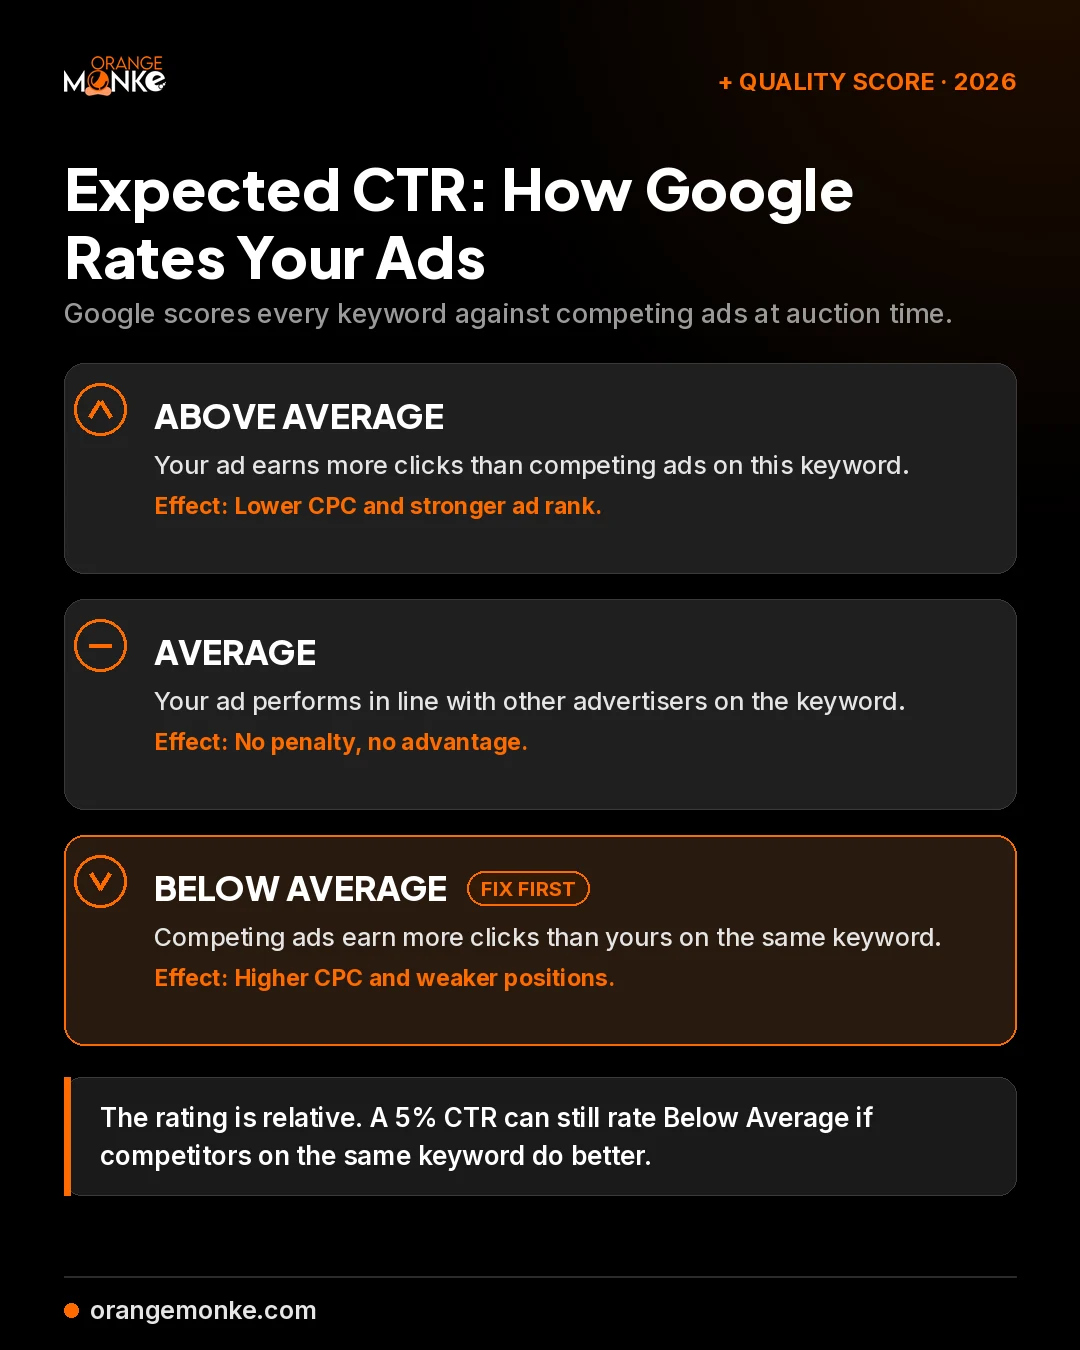
Expected CTR is Google's prediction of how likely your ad is to be clicked when it shows for a keyword, and Google's official documentation lists it as one of the three components of Quality Score alongside ad relevance and landing page experience. Google grades every keyword with one of three statuses: above average, average, or below average.
The rating is relative, not absolute. Google compares your ad against other advertisers bidding on the same keyword, and the comparison is recalculated at auction time using the actual search term, the device, and other live signals. That is why a CTR you consider healthy can still carry a below average status: if competing ads on that keyword consistently earn more clicks than yours, Google grades you against them, not against an industry table.
How Do You Fix a Below Average Expected CTR?
You fix a below average expected CTR by closing the relevance gap: competing ads out-click yours on that keyword, so make your ad the better match for the query. Work these four fixes in order:
- Mirror the query in your first headlineThe closer your headline sits to what the user typed, the more clicks it earns. Check the actual search terms triggering the keyword and match their wording.
- Cut the irrelevant impressionsAdd negative keywords so the keyword stops showing for queries it cannot win. Fewer wasted impressions means a higher measured CTR on the auctions that matter.
- Run the full asset stackSitelinks, callouts, structured snippets, and images make your ad larger and give users more reasons to click, which lifts CTR against competitors running bare ads.
- Isolate the keyword if it matters enoughMove a high-value keyword into its own tightly themed ad group with dedicated copy, so every headline speaks directly to that one query.
Check the rating in the Keywords view by adding the Quality Score columns, including Exp. CTR. Fix below average keywords first: they are paying a CPC penalty on every single auction.
What Are High CTR Keywords?
High CTR keywords are the terms in your account that earn clicks well above your average, and they share a recognisable profile. Most are branded terms, exact match keywords, or queries with strong commercial intent where the searcher already knows what they want.
The four traits that show up again and again:
- Branded terms. Searches that include your company or product name carry the highest intent of all, which is why branded campaigns benchmark at 20%+ CTR.
- Exact match keywords. Exact match filters out tangential queries, so nearly every impression is a genuine match, and the measured CTR climbs.
- High-intent modifiers. Queries containing words like "buy", "pricing", "near me", or "quote" signal a user ready to act, and ready users click.
- Question queries your headline answers word for word. When the ad headline mirrors the question, the ad reads like the answer, and it wins the click.
To find your own high CTR keywords, open the Keywords view, sort by CTR, and filter to a minimum impression count so one-impression flukes do not top the list. Then check the Search Terms report for query-level winners that are not yet keywords. Promote the winners to exact match in their own ad groups with dedicated copy, and they keep compounding: high CTR lifts Quality Score, which lowers CPC and improves position, which lifts CTR again.
Factors That Influence Your Google Ads CTR
Six structural factors decide whether your CTR runs above or below industry average. None of them are mysterious, and all of them are within your control.
1. Ad Position
Higher ad positions get clicked more: position 1 ads earn roughly 2x the CTR of position 4 ads on the search network. Bidding strategy, Quality Score, and ad assets all influence the position you earn. The same logic drives organic results too, which is why search engine positioning is its own discipline.
2. Ad Copy and Headlines
Your headlines do 80% of the CTR work. Strong ad copy starts with knowing your target audience, includes the searcher's keyword in the first headline, leads with a clear benefit (not a feature), names the product or service explicitly, and uses one of your three available headlines for a hard call-to-action.
3. Ad Assets (Formerly Extensions)
Sitelinks, callouts, structured snippets, prices, promotions, lead forms, and call assets make your ad physically larger on the SERP and give users more reasons to click. Ads with the full asset stack consistently see CTR uplifts of 10% to 25% over ads running headlines and descriptions alone.
4. Keyword Match Types and Search Intent
Broad match keywords expose your ad to many queries: some highly relevant, others tangential. The tangential ones get impressions but no clicks, dragging CTR down. Phrase and exact match deliver tighter intent matching and almost always higher CTR. Pair match types with a rigorous negative keyword list and CTR climbs further.
5. Quality Score
Quality Score and CTR are a two-way street. High CTR lifts Quality Score, and high Quality Score earns better positions, which lift CTR. Keywords with a Quality Score below 5 should be your first optimisation target.
6. Landing Page Experience
This one is less obvious. Google rewards ads that send users to relevant, fast, mobile-friendly landing pages, and over time, if your post-click experience is poor, Google will quietly reduce your impression share on competitive queries. That feedback loop affects future CTR even if your ad copy is unchanged.
How Do Seasonality and Competition Affect CTR?
Seasonality and auction competition move your CTR even when your ads never change. At peak seasons, more advertisers enter the auctions in your category, CPCs climb, the ad slots get crowded, and the available clicks get split across more near-identical ads. A CTR dip in a crowded window is often the auction changing, not your account breaking.
The reverse also holds. Well-timed promotions and seasonal ad copy usually pull CTR back above your baseline, because an ad that names the season or the sale stands out in a wall of generic headlines.
Three habits keep seasonal swings from misleading you:
- Track week over week, not just year over year. Weekly trend lines show auction pressure building in near real time, while annual snapshots hide it.
- Refresh creative before the peak, not during it. New headlines and assets need impression data to settle, so launch them ahead of the crowded window.
- Judge the dip against the auction, not the benchmark. If competitors flooded in and your impression share fell, a lower CTR is context, not failure.
How to Improve Your Google Ads CTR
To increase your Google Ads CTR, work these recommendations in order of speed: negatives first, match types second, copy and assets third, structure last. Improving CTR is a system, not a single hack. The advertisers who consistently beat industry benchmarks work through the following levers in order, fastest impact first.
Step 1: Audit Your Search Terms and Add Negative Keywords
Open the Search Terms report inside Google Ads. You will almost certainly find queries that are triggering your ads but that have nothing to do with what you actually sell, the paid-side twin of the query mining you do in keyword research. Each irrelevant impression drags your CTR down. Add the obvious mismatches as negative keywords. Adding a single well-targeted negative keyword can lift CTR within days and triple conversion rates in some accounts.
Step 2: Tighten Match Types
If your underperforming keywords are running on broad match, test phrase or exact match versions for two weeks. You will lose some impressions but keep the high-intent clicks, and CTR will rise. With Google's AI Max for Search expanding broad-match coverage in 2026 (one of the year's defining search trends), layering tight negatives is more important than ever.
Step 3: Rewrite Your Responsive Search Ads (RSAs)
Use all 15 headlines and 4 descriptions Google allows. Google's RSA system A/B tests the combinations for you, so your job is to feed it strong inputs. Google's RSA machinery only optimises what you feed it, and the strongest inputs come from real keyword research, not guesswork. Make sure at least three of your headlines:
- Contain the primary keyword
- Lead with a specific benefit (e.g. "Cut Your CPC by 30%", not "Best PPC Agency")
- Include a clear call-to-action ("Get a Free Audit", "Book a Demo Today")
- Check the Ad Strength rating after every edit and push every responsive search ad to Good or Excellent before saving
Step 4: Add Every Available Ad Asset
Ad assets are the cheapest CTR lift in the platform: they enlarge your ad on the SERP and typically add 10% to 25% CTR over bare ads. At a minimum, configure these on every campaign:
- Sitelink assets: 4 to 6 links to high-value pages (Pricing, Contact, Services, Case Studies)
- Callout assets: short benefit statements ("24/7 Support", "Free Strategy Call", "ISO Certified")
- Structured snippet assets: list out your services, brands, or types
- Image assets: for eligible accounts, image assets visibly increase ad real estate
- Call assets: especially powerful for service businesses where the click should be a phone call
- Promotion / Price assets for e-commerce
Beating the benchmark but still overpaying per click? Fix the Quality Score, not the bid.
We audit your expected CTR keyword by keyword and rebuild the ad groups that are paying a relevance penalty on every auction.
Get a free Google Ads audit →Step 5: Separate Branded and Non-Branded Campaigns
If you are currently running branded and non-branded keywords in the same campaign, split them. Branded campaigns can be capped at lower budgets and higher targets. Non-branded campaigns need their own bidding strategy, ad copy, and negatives. Splitting them gives you cleaner CTR data and lets you optimise each segment independently.
Step 6: Test Bidding Strategies
"Target Impression Share" bidding can lift CTR by forcing your ad into the top positions where CTR is naturally higher. "Maximize Clicks" optimises directly for click volume but may pull in lower-intent traffic. "Target ROAS" or "Maximize Conversions" deprioritise CTR in favour of value. Choose the strategy that matches your business goal, not what looks best on a CTR report.
Step 7: Improve Quality Score Keyword-by-Keyword
Filter your Keywords view to show Quality Score below 6. For each, check the three sub-components (expected CTR, ad relevance, landing page experience) and fix the weakest one. This is slow, methodical work, but it compounds: every Quality Score point you lift improves CTR and reduces CPC across the entire ad group.
If your team does not have the bandwidth to run this kind of weekly optimisation, the right paid marketing partner can take the load off, and the lift in CTR usually pays for the engagement many times over.
Common Google Ads CTR Mistakes to Avoid
Most CTR problems are self-inflicted. These are the patterns we see again and again when auditing underperforming Google Ads accounts.
Mistake 1: Chasing CTR at the Expense of Conversions
A 15% CTR on a campaign that converts at 0.5% is worse than a 6% CTR converting at 8%. CTR is a quality signal, not the goal. Always validate CTR improvements against conversion rate and cost per lead.
Mistake 2: Comparing Your CTR to the Wrong Benchmark
Comparing your Display CTR (0.4%) to a Search CTR benchmark (6.64%) and concluding your campaigns are broken is one of the most common misreads in PPC. Always compare like for like: same campaign type, same industry, same intent layer.
Mistake 3: Ignoring Search Terms
If you have never opened your Search Terms report, you are leaking budget. The cheapest, fastest CTR improvement in almost every account is removing the irrelevant queries triggering your ads.
Mistake 4: Set-and-Forget Ad Copy
Ad copy fatigues. A headline that worked nine months ago is rarely the best performer today. Refresh creative every 60 to 90 days and let Google's RSA system retest combinations.
Mistake 5: Running Broad Match Without Negatives
Broad match without a robust negative keyword list is one of the fastest ways to wreck your CTR. The match type is not the problem; running it unchecked is.
Mistake 6: Sending All Ad Clicks to the Homepage
Your homepage is rarely the right post-click destination. It dilutes intent, hurts landing page experience scores, and indirectly suppresses Quality Score and CTR. Build dedicated landing pages that match the ad message, backed by a real content strategy rather than a generic homepage.
Other Google Ads KPIs to Track Alongside CTR
CTR is one of six core Google Ads performance metrics, and reading it alone gives you half the picture. The paid media dashboards we build always pair it with the KPIs below. Watching it in isolation gives you half the picture. These are the KPIs to read together:
| Metric | What It Measures | 2026 Average / Benchmark |
|---|---|---|
| CTR | Click-through rate: clicks ÷ impressions | 6.64% |
| CPC | Cost per click: average cost of each ad click | $5.42 |
| CVR | Conversion rate: % of clicks that complete a goal | 8.18% |
| CPL | Cost per lead: total spend ÷ total conversions | $66.69 |
| Quality Score | 1–10 keyword rating from Google | Target: 7+ |
| Impression Share | % of available impressions you captured | Target: 60%+ |
| ROAS | Return on ad spend: revenue ÷ spend | Varies by industry |
Read these in pairs, never alone: CTR with Quality Score, CVR with CPL, CPC with impression share, and ROAS over everything.
Strong Google Ads accounts read these in pairs. CTR + Quality Score tells you about ad relevance. CVR + CPL tells you about post-click effectiveness. CPC + impression share tells you about budget efficiency. ROAS ties everything back to revenue. You may also see interaction rate in some reports: it is Google's broader version of CTR that counts the main interaction for any ad format (clicks on search ads, views on video ads) divided by impressions. Two neighbouring metrics cause confusion: CTR in Google Analytics reports the click-through of your organic search listings via the Search Console integration, and CTR in Google AdSense measures clicks on ads you host as a publisher. Neither is your Google Ads CTR.
Measure the post-click side in analytics too. Our guide on tracking website traffic in Google Analytics covers how to tie ad clicks to on-site behaviour and conversions.
If you are new to building a paid search programme from the ground up, the same discipline you use for organic search applies here too: start with audience and intent, then layer technical setup, then content, then measurement. Our guide on how to start SEO for a small website walks through the same audience-first approach, just on the organic side.
Conclusion
"What is a good CTR for Google Ads?" doesn't have a single answer, but it has a clear framework. In 2026, the universal Google Search average is 6.64%, branded campaigns should target 20% or higher, non-branded should clear 5%, and Display should sit between 0.5% and 1%. Beyond that, your real target is whatever beats the average for your specific industry, campaign type, and intent layer.
The advertisers who consistently outperform their CTR benchmarks aren't doing anything magical. They're segmenting branded and non-branded, tightening match types, refreshing ad copy on a schedule, exhausting every ad asset Google offers, and pairing CTR with Quality Score and CVR to spot problems early. The compounding effect (better CTR, higher Quality Score, lower CPC, better ad rank, more clicks at the same budget) is where Google Ads goes from a cost centre to a growth lever. Paid clicks work best alongside a plan to drive organic traffic too, so the same intent keeps converting after the budget stops.
If your CTR is currently below your industry benchmark and you'd like a second pair of eyes on the account, Orange MonkE builds and manages paid search campaigns for brands in the USA, UAE, and India, and we'll show you exactly where your CTR is leaking and how to fix it.
You know the 2026 benchmarks. Now find out where your account leaks clicks.
A senior paid media strategist walks your campaigns keyword by keyword: search terms, match types, assets, and Quality Score, with a fix list you keep.
Talk to a paid media strategist →Frequently Asked Questions
A good CTR for Google Ads in 2026 is anything above the 6.64% overall search average, with your own industry row as the real target.
- Search campaigns. Clear 6.64%, and treat 10%+ as excellent.
- Branded campaigns. 20% is the floor; 30%+ is excellent.
- Non-branded campaigns. Target above 5%.
- Display campaigns. 0.5% to 1% is good, above 1% is excellent.
If your account is under those lines, a paid marketing audit will show exactly which segment is dragging.
The average CTR for Google Ads search campaigns is 6.64% in 2026, based on WordStream's study of 13,474 US campaigns across 23 industries.
- Highest industry. Arts & Entertainment at 12.75%.
- Lowest industry. Automotive Repair, Service & Parts at 5.56%.
- Display average. Far lower, typically 0.35% to 0.46%.
Comparing paid channels? Our Facebook Ads benchmarks break down CTR the same way.
CTR in Google Ads is calculated by dividing ad clicks by impressions and multiplying by 100.
- The formula. (Clicks ÷ Impressions) × 100.
- Worked example. 500 clicks from 10,000 impressions = 5% CTR.
- Where it lives. Google calculates it automatically at campaign, ad group, keyword, and ad level.
Tie clicks to on-site behaviour with our guide to Google Analytics website traffic.
Expected CTR in Google Ads is Google's prediction of how likely your ad is to be clicked for a keyword, and it is one of the three components of Quality Score.
- The three statuses. Above average, average, or below average, assigned per keyword.
- How it is judged. Relative to other advertisers on the same keyword, recalculated at auction time.
- Why it matters. It sits alongside ad relevance and landing page experience in Quality Score, so it moves your CPC.
Fixing expected CTR keyword by keyword is core paid search management.
Your expected CTR is below average because competing ads on the same keyword consistently earn more clicks than yours; the rating is relative, not absolute.
- Mirror the query. Put the searcher's wording in your first headline.
- Cut waste. Add negative keywords so the keyword stops showing where it cannot win.
- Run every asset. Sitelinks, callouts, snippets, and images out-click bare ads.
- Isolate high-value keywords. Give them their own tightly themed ad group.
Ad position compounds the problem, and the mechanics are the same ones behind search engine positioning.
High CTR keywords are the terms in your account that earn clicks well above your average, usually branded terms, exact match keywords, or high commercial intent queries.
- Branded terms. Benchmark at 20%+ CTR because intent is highest.
- Exact match. Filters out tangential queries, so measured CTR climbs.
- Intent modifiers. Words like "buy", "pricing", and "near me" signal users ready to act.
- How to find them. Sort the Keywords view by CTR with a minimum impression filter, then mine the Search Terms report.
Surface these terms before you bid with proper keyword research.
A low Google Ads CTR usually points to weak ad relevance, mismatched search intent, missing ad assets, low ad rank, or broad targeting that triggers ads for unrelated queries.
- Fastest fix. Add negative keywords from the Search Terms report.
- Second fix. Tighten broad match to phrase or exact.
- Third fix. Refresh headlines and enable sitelinks and callouts.
Most accounts see CTR lift within weeks once a paid media team works those three levers in order.
A high CTR in Google Ads is generally anything double your industry average: 10%+ on non-branded search, 25% to 30%+ on branded, and above 1% on display.
- Non-branded search. 10% or higher is excellent.
- Branded search. Above 25% to 30% is high.
- Display network. Above 1% is high for passive placements.
High CTR starts with relevance, and relevance starts with knowing your target audience.
No, a high CTR alone does not make a Google Ads campaign successful, because clicks that never convert still cost money.
- What CTR proves. Your ad is compelling and relevant to the query.
- What it cannot prove. That the traffic converts into leads or revenue.
- What to pair it with. Conversion rate, cost per lead, and ROAS.
Paid clicks work best alongside a plan to get organic traffic, so the same intent keeps converting after the budget stops.
CTR affects Quality Score directly, because expected CTR is one of its three core inputs, and a higher Quality Score lowers your cost per click.
- The chain. Higher CTR raises expected CTR, which raises Quality Score.
- The payoff. Higher Quality Score cuts CPC and improves ad rank at the same bid.
- The compounding. Better positions then lift CTR again.
For shopping-heavy accounts, the same chain runs through the feed, which is why e-commerce PPC management centres on it.
Yes, seasonality affects Google Ads CTR because peak seasons bring more advertisers into the same auctions, splitting clicks across more competing ads.
- What happens. CPCs climb, ad slots crowd, and CTR can dip with no change in your ads.
- How to read it. Track CTR week over week, not only year over year.
- How to fight it. Refresh seasonal ad copy before the crowded window starts.
Plan those seasonal pushes inside a real content marketing strategy so ads and content pull together.
A good CTR for Google Display Network ads sits between 0.5% and 1%, against a network average of roughly 0.35% to 0.46%.
- Why it is lower. Display users are reading or browsing, not searching for you.
- What beats the average. Responsive display assets, tighter audiences, and regular creative refreshes.
- What counts as high. Anything above 1% on display.
A paid marketing team can pair display prospecting with search capture so each surface is judged on its own job.
Most Google Ads CTR improvements show within 2 to 4 weeks, with structural changes taking 4 to 8 weeks to stabilise.
- Fast wins. Negative keywords, tighter match types, and refreshed copy move CTR in days to weeks.
- Slow wins. Rebuilt ad groups and Performance Max migrations need 4 to 8 weeks of impression data.
- Why the lag. Google's Smart Bidding retrains on the new signals.
That is still far faster than organic, where our guide on starting SEO for a small website sets month-scale expectations.
No, conversion rate is the more bottom-line metric, because it measures the clicks that actually generate leads or sales.
- CTR's job. Signal ad quality and lower CPC through Quality Score.
- CVR's job. Tell you whether the campaign makes money.
- The right read. Judge CTR and CVR together, never either one alone.
The metric debates change, the fundamentals do not, which is the same answer we give to is SEO dead.