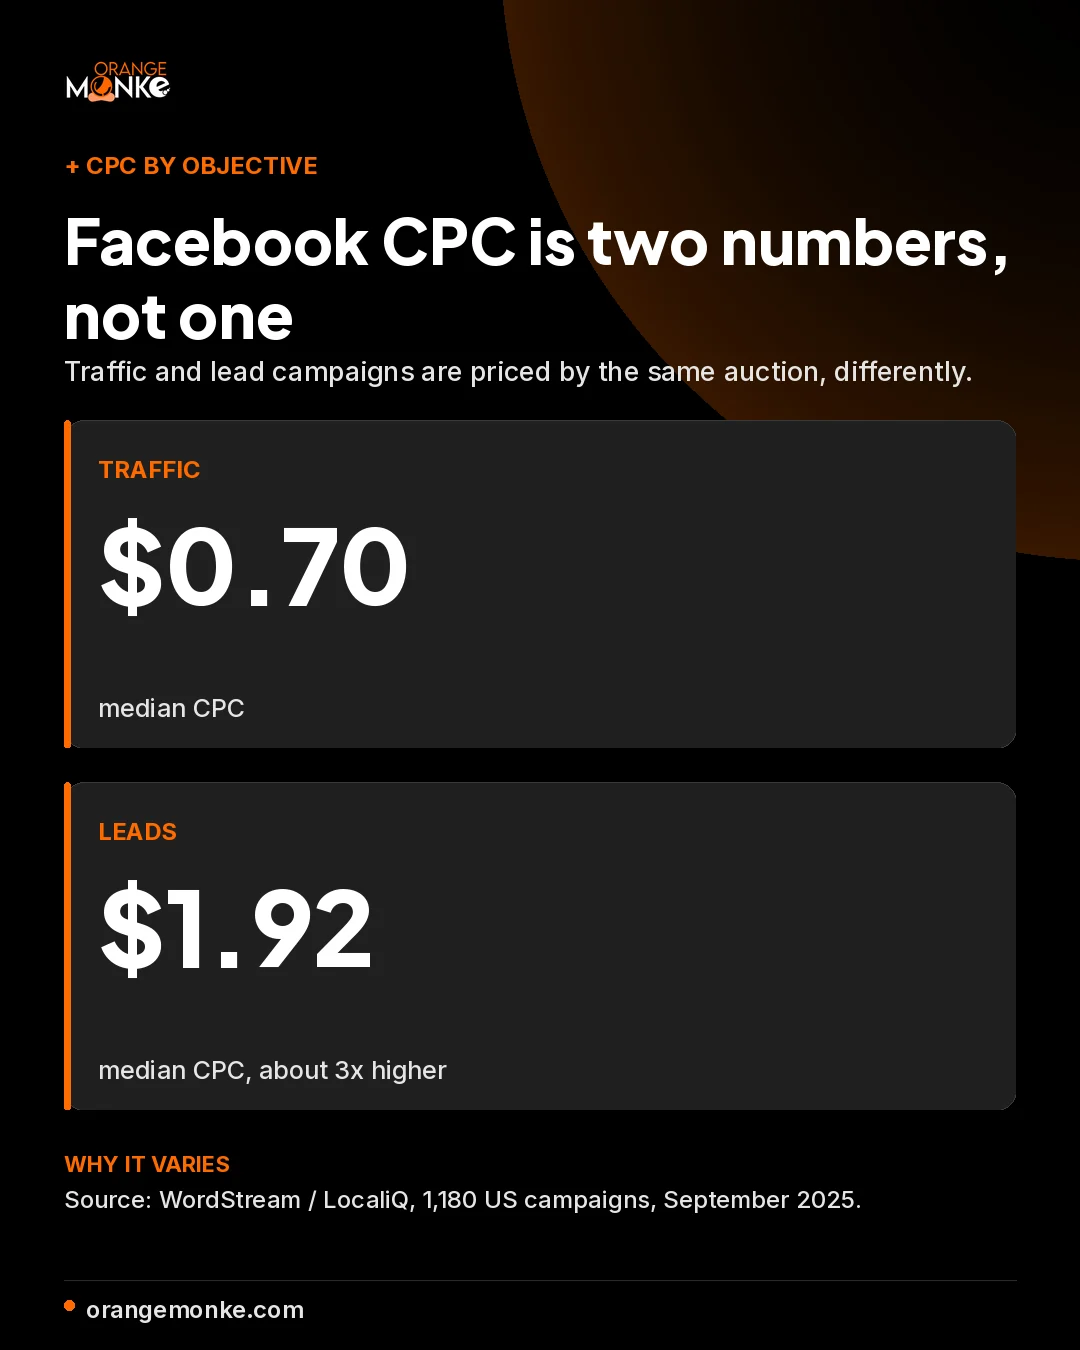
- Facebook CPC is two numbers, not one. Median CPC is $0.70 for traffic campaigns and $1.92 for lead campaigns. Quoting a single blended "$1.72" CPC, as many 2026 posts do, hides the part that decides your budget. Source: WordStream / LocaliQ, 1,180 US campaigns, September 2025.
- Costs rose again in 2026, and Meta's own filings prove it. In Q1 2026, Meta's average price per ad climbed 12% worldwide and 14% in the US and Canada, even as ad impressions grew 13% in that region. The lift came from pricing, not a bigger audience. Source: Meta Q1 2026 earnings, 29 April 2026.
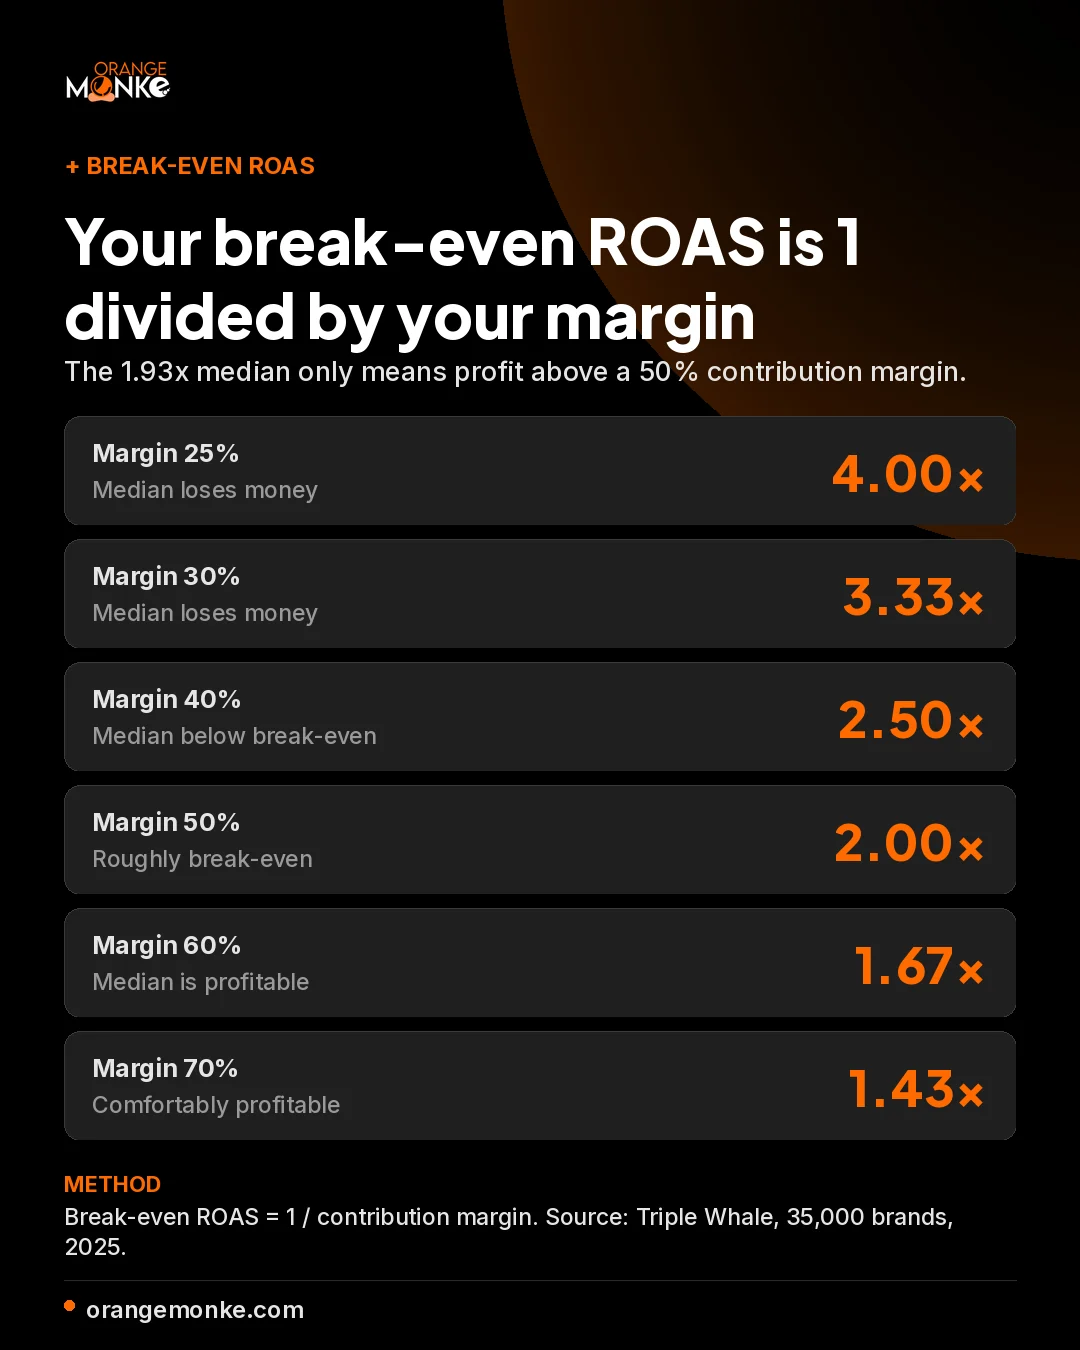
- A "good" ROAS is mechanical, not aspirational. The median ecommerce ROAS on Meta is 1.93x, but your real target is 1 divided by your contribution margin. A 40% margin breaks even at 2.5x; a 25% margin needs 4.0x. The universal "aim for 4x" advice is wrong for most accounts. Source: Triple Whale, 35,000 brands, 2025.
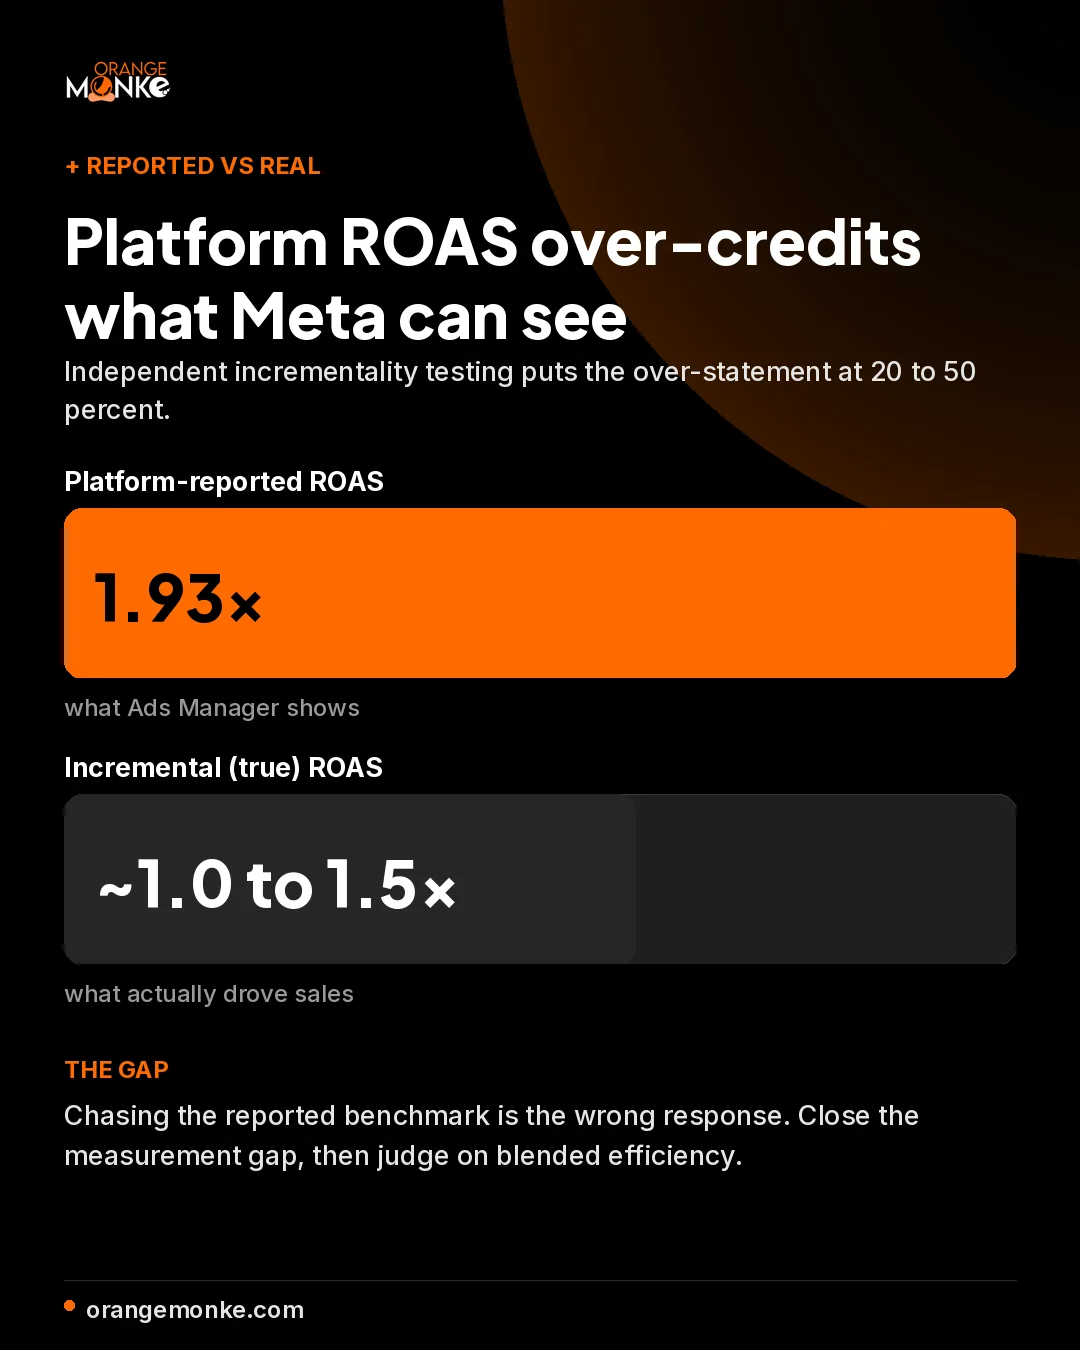
- Your real numbers will look worse than these benchmarks, and that is expected. Platform-reported ROAS over-attributes by roughly 20% to 50% versus incrementality testing, and Meta removed its 7-day and 28-day view-through windows on 12 January 2026.
What are Facebook ad benchmarks (and why will your numbers differ)?
Facebook ad benchmarks are median performance figures, drawn from large samples of real campaigns, that tell you what an average advertiser pays and earns on Meta. They cover cost per click (CPC), cost per thousand impressions (CPM), click-through rate (CTR), conversion rate (CVR), cost per lead (CPL), cost per acquisition (CPA), and return on ad spend (ROAS). They exist so you can tell whether a $1.40 CPC or a 2.1x ROAS is healthy for your category, or a warning sign.
Three things matter before you use any benchmark, and most benchmark posts skip all three.
Benchmarks use the median, not the average
Ad performance is lopsided. A handful of huge spenders or a few failed campaigns can drag a mean far from reality. Reputable reports publish medians, the middle of the pack, because that is the safer guardrail. When a source quotes a clean "average," check whether it means median; the gap can be large.
The objective changes the number more than the industry does
A Facebook traffic campaign and a Facebook lead campaign are priced differently by the same auction. Median traffic CPC is $0.70; median lead CPC is $1.92, nearly three times higher, on the same platform in the same year. Any benchmark you read is only useful once you know which objective it measured. Source: WordStream / LocaliQ, September 2025.
Benchmarks describe reported performance, not incremental performance
Every figure here comes from platform-reported or attribution-tool data. Independent incrementality tests typically find that platform-reported ROAS overstates true contribution by 20% to 50%, depending on vertical. Treat benchmarks as a way to spot anomalies in your account, not as profit targets. Your unit economics decide your targets.
Are Facebook ad costs going up in 2026?
Yes. Facebook ad costs rose again in 2026, and the most reliable evidence is Meta's own quarterly filing rather than any third-party estimate. In the first quarter of 2026, reported on 29 April 2026, Meta's average price per ad increased 12% year over year worldwide and 14% in the US and Canada, while ad impressions grew 19% globally and 13% in the US and Canada. Total advertising revenue reached $55.02 billion for the quarter, up 33% year over year.
There is an important nuance for advertisers here.
- Meta's family daily active people grew only about 4% year over year, reaching 3.56 billion in March 2026, so the higher cost is not the symptom of a shrinking audience.
- It comes from the auction, where more advertisers compete for the same attention while Meta's AI delivery squeezes more revenue out of every impression.
- That dynamic favours large incumbents with deep creative libraries, and it leaves smaller advertisers needing sharper creative testing and tighter targeting to hold their cost per result.
Meta does not report CPC. It reports average price per ad. Posts that publish a precise "2026 Meta ad revenue" figure below $200 billion are using stale data: Meta's full-year 2025 revenue was $200.97 billion (up 22%), and Q1 2026 alone delivered $55 billion in ad revenue. Forecasters at eMarketer expect Meta to overtake Google in global ad revenue by the end of 2026. Source: Meta Investor Relations; eMarketer, April 2026.
Average Facebook CPC by industry
The median Facebook cost per click in 2026 is $0.70 for traffic campaigns and $1.92 for lead campaigns. Those are two distinct numbers because the auction prices them differently: traffic campaigns optimise for cheap clicks, while lead campaigns chase higher-intent users and pay a premium for them. Below are both, broken out by industry, from WordStream and LocaliQ's analysis of 1,180 US campaigns running between April 2024 and June 2025. All figures are medians.
Facebook CPC by industry: traffic campaigns
Across all industries, traffic-campaign CPC is $0.70, down from $0.77 the prior year. The cheapest clicks go to high-engagement consumer categories; the most expensive go to high-value service categories.
| Industry | Median CPC (traffic) |
|---|---|
| Shopping, Collectibles & Gifts | $0.34 |
| Sports & Recreation | $0.41 |
| Arts & Entertainment | $0.49 |
| Travel | $0.51 |
| Restaurants & Food | $0.72 |
| Beauty & Personal Care | $0.74 |
| Business Services | $0.75 |
| Animals & Pets | $0.78 |
| Automotive (For Sale) | $0.79 |
| Health & Fitness | $0.80 |
| Automotive (Repair, Service & Parts) | $0.81 |
| Physicians & Surgeons | $0.82 |
| Furniture | $0.85 |
| Apparel / Fashion & Jewelry | $0.86 |
| Attorneys & Legal Services | $0.86 |
| Education & Instruction | $0.86 |
| Industrial & Commercial | $0.86 |
| Real Estate | $0.91 |
| Home & Home Improvement | $0.99 |
| Personal Services | $1.00 |
| Finance & Insurance | $1.22 |
Facebook CPC by industry: lead campaigns
Lead-campaign CPC is $1.92 on average, up slightly from $1.88. The spread here is wider because service categories with high client value, such as dentistry and legal, pay far more per click than low-friction consumer offers.
| Industry | Median CPC (leads) |
|---|---|
| Restaurants & Food | $0.74 |
| Career & Employment | $0.86 |
| Sports & Recreation | $1.07 |
| Arts & Entertainment | $1.08 |
| Real Estate | $1.57 |
| Education & Instruction | $1.65 |
| Industrial & Commercial | $1.80 |
| Personal Services | $2.08 |
| Furniture | $2.18 |
| Home & Home Improvement | $2.23 |
| Physicians & Surgeons | $2.23 |
| Health & Fitness | $2.64 |
| Beauty & Personal Care | $3.06 |
| Attorneys & Legal Services | $4.10 |
| Dentists & Dental Services | $9.78 |
Where CPC fell
Year over year, the biggest traffic-CPC drops were Shopping and Collectibles (down 46%), Sports and Recreation (down 40%), and Beauty (down 21%).
Where CPC rose
The biggest traffic-CPC increases were Restaurants and Food (up 44%), Real Estate (up 40%), and Animals and Pets (up 39%). For leads, Dentists jumped 139%.
The WordStream tables cover lead generation and service campaigns. For ecommerce, the cleaner benchmark is the global median CPC of roughly $1.11 across 2025, which holds between $1.05 and $1.15 most of the year, peaks at $1.32 in November, then resets to $0.85 in January. Source: Superads, $3 billion in ad spend tracked, January 2025 to January 2026.
Facebook CPM benchmarks
The median Facebook CPM in 2026 is about $13.48 for ecommerce, based on Triple Whale's analysis of nearly 35,000 brands across full-year 2025. Blended CPMs across all verticals sit in the high single digits to low teens. The reason sources disagree is that they measure different advertiser mixes, so the honest answer is a range, shown below, not a single figure.
| Source (what it measures) | Median CPM | Period |
|---|---|---|
| Triple Whale (ecommerce, ~35,000 brands) | $13.48 | Full-year 2025 |
| Superads (global, all verticals) | ~$13.48 | 2025 |
| WebFX (Facebook placement) | $7.47 | 2026 |
| WebFX (Instagram placement) | $6.25 to $7.68 | 2026 |
| General "healthy" range (blended) | $8 to $15 | 2025 to 2026 |
CPM rose roughly 20% across 2025, driven by more advertisers competing in the same auction. That increase came alongside an 8.3% rise in conversion rates, which suggests Meta's delivery system also got better at finding buyers, so brands with strong creative absorbed the higher CPM through better conversion efficiency.
A single annual CPM median misleads you in Q4. CPMs climb from October, peak in November, and on Black Friday and Cyber Monday commonly run two to three times the annual baseline. If you plan a holiday budget against the $13 median, you will underfund it. Source: industry CPM seasonality data, 2025 to 2026.
Facebook CTR benchmarks by industry and format
A good Facebook CTR in 2026 is above 1.5% for most verticals. The median traffic-campaign CTR is 1.71%, the median lead-campaign CTR is 2.59%, and the median ecommerce CTR is 2.19%. Before comparing your own number, know which CTR you are measuring, because there are two.
CTR is not one number: all clicks versus link clicks
CTR (All) counts every click, including post expansions, profile taps, and reactions. Link CTR counts only clicks through to your destination. Databox's cross-company data puts the median CTR (All) at about 1.81% and median Link CTR at about 1.03%, last updated 2 March 2026. If your goal is website traffic, Link CTR is the cleaner number to benchmark against; CTR (All) inflates when people click things that are not your link.
Facebook CTR by industry: traffic campaigns
Consumer categories that sell "anytime treats" lead on CTR; high-consideration service categories trail.
| Industry | Median CTR (traffic) |
|---|---|
| Shopping, Collectibles & Gifts | 4.13% |
| Travel | 2.76% |
| Sports & Recreation | 2.60% |
| Arts & Entertainment | 2.10% |
| Beauty & Personal Care | 1.81% |
| Attorneys & Legal Services | 1.76% |
| Personal Services | 1.70% |
| Real Estate | 1.68% |
| Restaurants & Food | 1.67% |
| Animals & Pets | 1.64% |
| Health & Fitness | 1.63% |
| Automotive (For Sale) | 1.48% |
| Education & Instruction | 1.45% |
| Furniture | 1.39% |
| Business Services | 1.38% |
| Industrial & Commercial | 1.36% |
| Apparel / Fashion & Jewelry | 1.29% |
| Home & Home Improvement | 1.28% |
| Finance & Insurance | 0.98% |
| Physicians & Surgeons | 0.83% |
| Automotive (Repair, Service & Parts) | 0.80% |
Ecommerce CTR leaders (2025)
Health & Wellness 2.70%, Books & Music 2.34%, Media & Publishing 2.21%. Every industry in Triple Whale's set improved CTR year over year. Food & Beverage trailed at 1.85%.
A high CTR can still be a warning
Triple Whale flagged Travel Accessories, where CTR rose 17% while CVR fell 17%. More clicks that convert less usually means post-click friction or an offer problem, not a creative win.
Facebook conversion rate benchmarks
Facebook conversion rates split sharply by objective. The median ecommerce conversion rate on Meta is 1.57%, up 8.3% year over year, while the median lead-generation conversion rate is 7.72%, down from 8.67% the prior year. The two are not comparable: an ecommerce purchase is a higher bar than a lead-form submission, so the rates live on different scales. For ecommerce specifically, Food and Beverage converts highest at 2.02% and Electronics lowest at 1.20%.
Lead-campaign conversion rate by industry
| Industry | Median CVR (leads) |
|---|---|
| Restaurants & Food | 18.25% |
| Attorneys & Legal Services | 10.53% |
| Education & Instruction | 10.08% |
| Real Estate | 9.53% |
| Arts & Entertainment | 9.34% |
| Industrial & Commercial | 9.34% |
| Personal Services | 6.51% |
| Dentists & Dental Services | 6.38% |
| Career & Employment | 5.77% |
| Health & Fitness | 5.63% |
| Sports & Recreation | 5.48% |
| Beauty & Personal Care | 5.29% |
| Home & Home Improvement | 5.22% |
| Physicians & Surgeons | 4.51% |
| Furniture | 3.77% |
Facebook ROAS benchmarks by industry
The median Facebook ROAS for ecommerce is 1.93x in 2026, meaning the median brand earns $1.93 in attributed revenue for every $1 spent. The average account ROAS is higher, at 2.98x, but that figure is skewed by top performers, which is exactly why the median is the number to use. Twelve of fifteen verticals improved ROAS year over year in 2025, a brighter picture than the near-universal CPM increases over the same period.
| Industry | Median ROAS |
|---|---|
| Automotive | 2.54x |
| Sports & Outdoors | 2.28x |
| Travel Accessories & Luggage | 2.25x |
| Home & Garden | 2.18x |
| Pets & Animals | 1.58x |
| Beauty & Personal Care | 1.57x |
| Food & Beverage | 1.56x |
| Media & Publishing | 1.17x |
What is a good ROAS for your business? (it is not 4x)
The single most repeated mistake in benchmark posts is telling every advertiser to aim for a 4x ROAS. Your real break-even ROAS is mechanical: it is 1 divided by your contribution margin. A brand with 60% margins is profitable at 1.67x; a brand with 25% margins loses money until 4.0x. Same platform, opposite verdicts on the same ROAS number. Calculate your break-even first, then read the benchmark.
| Your contribution margin | Break-even ROAS | Read on the 1.93x median |
|---|---|---|
| 25% | 4.00x | Median is unprofitable for you |
| 30% | 3.33x | Median is unprofitable for you |
| 40% | 2.50x | Median is below break-even |
| 50% | 2.00x | Median is roughly break-even |
| 60% | 1.67x | Median is profitable |
| 70% | 1.43x | Median is comfortably profitable |
Method: break-even ROAS = 1 / contribution margin. Calculate this before benchmarking, not after.
Two more facts worth holding next to any ROAS benchmark. Retargeting delivers about 71% higher ROAS than prospecting, so a blended account average hides which engine is actually working. And across the channel, Google's median ecommerce ROAS (3.68x) runs higher than Meta's (1.93x), though the per-vertical gap is much narrower, and Baby Products is the one category where Meta beats Google.
Free break-even ROAS calculator
A benchmark only matters once you compare it to the ROAS your own margins require. Enter your contribution margin to see your break-even ROAS, then enter the ROAS your Ads Manager reports. The third slider does what no generic calculator does: it discounts your reported ROAS for the attribution gap covered earlier on this page, so you see the true number, not the over-reported one. No email required, and nothing leaves your browser.
Method: break-even ROAS = 1 / contribution margin. True ROAS = reported ROAS times (1 minus attribution haircut). Industry reference: median ecommerce ROAS is 1.93x. This tool is a planning guide, not financial advice.
Facebook cost per lead and cost per acquisition
The median Facebook cost per lead is $27.66 in 2026, up about 21% year over year, but still far below Google's average CPL of $70.11. For ecommerce stores, the median cost per acquisition is $38.17, ranging from roughly $29.99 in Lifestyle to $49.48 in Electronics. As with every metric here, the category sets the baseline before any optimisation.
| Industry | Median CPL (leads) |
|---|---|
| Restaurants & Food | $3.16 |
| Real Estate | $16.61 |
| Career & Employment | $17.64 |
| Arts & Entertainment | $18.17 |
| Attorneys & Legal Services | $18.17 |
| Sports & Recreation | $19.30 |
| Education & Instruction | $28.22 |
| Personal Services | $30.57 |
| Industrial & Commercial | $37.34 |
| Furniture | $40.04 |
| Home & Home Improvement | $41.26 |
| Physicians & Surgeons | $47.47 |
| Beauty & Personal Care | $51.42 |
| Health & Fitness | $52.98 |
| Dentists & Dental Services | $76.71 |
Advantage+ and AI campaign performance
Meta's Advantage+ campaigns now run the majority of ecommerce ad spend, and they do outperform manual setups, but by less than the headline numbers some posts quote. Meta's own A/B testing reports roughly 12% lower cost per purchase and about 17% more purchases per dollar versus manual business-as-usual campaigns. Third-party data lands in a similar range: Advantage+ Shopping averages 4.52x ROAS against 3.70x for manual, a 22% improvement, and practitioners typically see 10% to 20% lower CPA once a campaign has enough conversion volume to learn.
Several 2026 posts headline a flat 32% lower CPA for Advantage+ versus manual. That number is real but mislabelled: Meta cites it for cost per incremental conversion when Advantage+ runs alongside manual campaigns, not as a like-for-like CPA comparison. The honest like-for-like figure is roughly 12% to 22%. The advantage is also data-dependent: it is widest for accounts spending over $10,000 a month and thin for accounts under $2,000, because the algorithm needs conversion volume to optimise.
Facebook vs Instagram vs Reels vs Threads benchmarks
Within Meta's ecosystem, placements price differently, and the mix shapes the cost of any Facebook and Instagram advertising programme. Facebook and Instagram have comparable CPMs, but Instagram carries a higher CPC because users engage visually and click less often. Instagram Stories is the most cost-efficient placement for clicks, running about 45% cheaper per click than Feed. Threads, opened to all advertisers on 21 January 2026, is the cheap new inventory.
| Placement | CPM | CPC |
|---|---|---|
| Facebook (Feed) | $7.47 | $1.06 |
| Instagram (Feed) | $6.25 to $7.68 | $3.35 |
| Instagram (Stories) | $6.25 to $7.68 | $1.83 |
| Threads | ~30 to 40% below Instagram | Early beta |
Threads in 2026
Threads passed 400 million monthly active users by early 2026 and opened ads globally on 21 January 2026. Early CPMs run 30% to 40% below Instagram. Treat the discount as a land-grab window, not permanent pricing.
Reels and video
Video ads earn a marginally higher CTR than static (roughly 1.0% versus 0.91% median), and the gap widens in Reels placements. Reels and short-form now account for an estimated 25% to 45% of impressions on full-placement accounts.
One correction worth making, because it circulates widely: the often-quoted figure of 275 million Threads users is the count from late 2024. As of early 2026 the platform is past 400 million monthly active users, and Instagram itself reached 3 billion monthly active users in September 2025, not the 2.35 billion some 2026 reports still cite.
You have the benchmarks. Do you have the measurement that makes them mean anything?
Orange MonkE runs paid social for US small businesses and white-label partners, with server-side tracking and margin-based targets built in from day one. Get a free, no-obligation audit of your Facebook and Instagram ad accounts.
Get a free ad account audit →Why don't your real Facebook numbers match these benchmarks?
If your reported ROAS, CPA, and conversion counts look worse than the benchmarks on this page, the most likely cause is not your campaigns. It is attribution. Benchmarks describe what platforms report, and platform reporting has been getting less complete every year since Apple's privacy changes. This is the question advertisers ask most often and the one benchmark posts almost never answer.
What changed in 2026?
- Attribution windows shrank. On 12 January 2026, Meta removed its 7-day view-through and 28-day view-through attribution windows.
- iOS hides conversions. Roughly 75% of iOS users opt out of tracking through Apple's App Tracking Transparency, and iOS 17 and 18 strip click identifiers such as fbclid from Safari links.
- The practical result: moving from a 28-day to a 7-day click window alone cuts reported conversions by 15% to 30%, and for iOS-heavy audiences Meta now estimates 30% to 50% of conversions with machine learning rather than measuring them directly.
What it means for benchmarking
Independent incrementality and media-mix testing typically finds that platform-reported ROAS overstates true contribution by 20% to 50%. So two things are true at once: the benchmarks here are accurate as reported figures, and your own reported figures are an incomplete picture of reality. Chasing the benchmark is the wrong response to that. The work is to set up conversion tracking properly, close the measurement gap with server-side tracking through the Conversions API, which recovers 20% to 40% of the conversions the browser pixel misses, and then to judge the account on blended marketing efficiency rather than on platform-reported ROAS alone.
Reconciling the two views starts with clean campaign links. Consistent UTM tagging lets you match store revenue against Ads Manager over the same dates, so you can see the gap instead of guessing at it.
Beyond the standard benchmarks, experienced ecommerce operators track nCAC (new customer acquisition cost), MER (blended marketing efficiency ratio), and hook rate and hold rate on creative. Standard benchmarks are good for spotting anomalies. Your P&L decides what to do about them.
What do advertisers actually report in 2026 (Reddit & Quora)?
Every table above reports what platforms and analytics tools measure. This section reports something different: what working advertisers say they are living with, in their own public posts across Reddit communities like r/PPC and r/FacebookAds, on Quora, and in practitioner write-ups through 2026. We include it because it is the layer every benchmark post leaves out, and because the gap between the two is the most useful signal of all.
This is a qualitative snapshot of public advertiser discussion, not a statistical sample. People post when their numbers are unusually good or unusually bad, so self-reported figures skew toward the extremes. Treat the section below as sentiment and lived experience, not as a benchmark to plan against. The official medians higher up this page remain the figures to budget with.
Five themes come up again and again when advertisers compare notes in 2026.
"Shopify shows more revenue than Ads Manager"
This is the complaint that comes up most. Store revenue and the revenue Meta reports stop lining up, which sends advertisers hunting for a tracking bug that turns out to be lost attribution.
"ROAS that used to be reliable is now unpredictable"
Operators across ecommerce, lead gen, and DTC describe the same swing, and "the algorithm changed" has become the catch-all explanation that explains nothing.
"My CPA looks awful but sales are fine"
Reported cost per acquisition climbs while actual orders hold steady. The campaign looks like it is failing in Ads Manager and working in the bank account.
"Advantage+ is cheap but the leads are junk"
The cost per lead falls, and so does lead quality. Advertisers report form-fills and bot submissions that never become customers, because the campaign was optimised toward the wrong signal.
The March 2026 "Andromeda" update is behind much of the 2026 frustration
Threads with titles like "is it just me or are Meta ads not working like they used to" and "eight years running and performance has never been this bad" cluster around one event. In the first week of March 2026, Meta rolled out an unannounced delivery update widely called Andromeda, and most advertisers found out through sudden drops rather than any announcement. Across retail, lead generation, and ecommerce, advertisers reported CPMs up 15% to 40% and ROAS declines within the first two weeks.
Two things changed at once, which is why the threads read as confusion rather than a clean diagnosis. Delivery shifted from audience-led to creative-led: detailed interest targeting became a hint, and the system now reads your creative and finds buyers across Meta's full base. At the same time, attribution tightened, so reported performance looked 15% to 40% worse even where actual sales held. The accounts hit hardest tended to be complex, manually targeted builds running thin creative, while the ones that held up leaned on consolidated campaigns, broad targeting, and fresh creative every two to three weeks. That refresh pace mattered more than it used to, since fatigue windows had shortened from roughly four to six weeks down to two to three.
The self-reported reality gap
Lined up against the official medians, the recurring operator reports point in a consistent direction. Each gap below has a documented cause, which is exactly why these are not random griping.
| Metric | Official 2026 median | What operators commonly report | Documented cause of the gap |
|---|---|---|---|
| CPM | $13.48 | $20 to $40+ in competitive niches and Q4 | Auction inflation, plus Black Friday and Cyber Monday running two to three times the baseline |
| Platform vs actual ROAS | 1.93x reported | True or blended ROAS 20% to 50% below the platform number | Platform over-attributes the conversions it can see; incrementality tests confirm the gap |
| Reported revenue | Ads Manager headline | Store revenue does not match Ads Manager either way | iOS opt-out and stripped click IDs hide conversions the pixel never sees |
| Advantage+ leads | 12% to 22% cheaper | Cheaper cost per lead, lower lead quality | Optimised to a form-fill signal, not a revenue signal |
| CPA after privacy changes | $38.17 | Reported CPA looks worse than true CPA | Conversions estimated, not measured, for iOS-heavy audiences |
How we built this: Orange MonkE qualitative review of public advertiser discussions (Reddit, Quora) and 2026 practitioner reporting. Self-reported and directional, not a statistical sample. Each "documented cause" maps to the sourced data elsewhere in this report.
None of this means the official benchmarks are wrong. They describe a clean, measured world, while advertisers live in a messier one shaped by seasonality, auction competition, and broken tracking. So if your own numbers feel worse than the medians on this page, the problem usually is not that you are failing the benchmark. You are running into the same gap that thousands of other operators describe, and what it calls for is better measurement, not panic.
Why are my Facebook ads so expensive?
When a Facebook account runs well above the cost benchmarks, the cause is almost always one of six things. Work through them in order before you conclude the platform is broken.
1. A high-cost vertical
Finance, insurance, legal, and dentistry sit at the top of every cost table. If you are in one, the benchmark for your category, not the all-industry median, is your real comparison point.
2. Q4 and seasonal spikes
October through December pushes CPMs up, and Black Friday and Cyber Monday run two to three times the annual baseline. A November CPA is not comparable to a March CPA.
3. Targeting that is too narrow
Small, over-segmented audiences force the auction to pay a premium to reach them and starve the algorithm of the conversions it needs to optimise. Broader, creative-led targeting usually lowers cost.
4. Fatigued creative
Keep an eye on frequency, which sits near 3.0 at the median. When it climbs week over week while CTR slips, the hook has gone stale, so refresh the creative before you start slicing the audience any thinner.
5. Low ad quality and relevance
Meta prices each impression partly on estimated action rates and ad quality. Weak relevance raises your effective CPM and CPC regardless of bid.
6. Missing conversion tracking
The quiet one: if your tracking misses conversions, your CPA only looks expensive because Meta is not counting all the orders your ads actually drove. Fix tracking before cutting budget.
How do you use these benchmarks without getting fooled?
Benchmarks are guardrails, not goals. They tell you where the market sits and flag when something in your account is off, but they should never be the target you optimise toward. Use them in three layers, in this order.
- Find your vertical's median on Metafrom the right objective, traffic or leads or ecommerce.
- Calculate your own break-even ROASfrom your contribution margin, because that, not a universal 4x, is the line that defines profit for you.
- Judge the whole account on blended efficiencyand new-customer acquisition cost, since platform-reported numbers over-attribute.
If your CPM is three times the median, that tells you something real about targeting or creative. If your reported ROAS is below the median, check your margin math and your attribution before you touch the campaigns.
Paid social also works hardest when it is not carrying every visitor alone. The teams that hold cost per result steady tend to integrate paid media with SEO and PPC so that owned demand cushions the account when the auction gets more expensive.
Conclusion
Facebook ad benchmarks are guardrails, not targets. The medians on this page, $0.70 traffic CPC, $13.48 CPM, and 1.93x ROAS, tell you where the market sits, but they only mean something once you read them against your own objective, your vertical, and your contribution margin.
Two habits separate the accounts that stay profitable from the ones that panic. Calculate your break-even ROAS from your margin before comparing to any benchmark, and judge the account on blended efficiency and new-customer acquisition cost, because platform-reported numbers overstate true contribution by 20% to 50%. If your reported figures look worse than the medians here, the answer is almost always better measurement, not a smaller budget.
At Orange MonkE, we help US small businesses and white-label partners turn these benchmarks into profitable campaigns, with server-side tracking and margin-based targets built in from the start. That is how you move from reading the numbers to beating them.
Your reported numbers might be lying to you. Let us check.
Most accounts that look like they are underperforming are actually mis-measured. We audit your tracking, attribution, and structure, then benchmark the account against your own margins. You keep the findings whether or not we work together.
Talk to a paid media strategist →Frequently asked questions
A good Facebook CPC in 2026 is under $0.80 for traffic campaigns and under $2.00 for lead campaigns, measured against platform medians of $0.70 and $1.92. There is no single number, because the auction prices each objective differently and your country and industry move it further.
- By objective: traffic averages $0.70, leads $1.92, nearly three times higher for the same advertiser.
- Cheapest verticals: Shopping ($0.34), Sports & Recreation ($0.41), Arts & Entertainment ($0.49).
- Most expensive: Finance & Insurance ($1.22 traffic); Dentists ($9.78) and Attorneys ($4.10) on leads.
- By geography: the US and Canada are among the priciest markets, so a US target runs higher than a global one.
- A higher CPC is not automatically a problem. A $4 click on a legal lead campaign can return far more than a $0.40 click on a low-value offer, because the value behind the click decides profit, not the click price. Benchmark against your own objective and vertical, and always read CPC next to conversion rate and cost per lead.
A good Facebook CTR in 2026 is above 1.5% for most verticals, against medians of 1.71% (traffic), 2.59% (leads), and 2.19% (ecommerce). Before you judge yours, confirm which CTR you are reading, because Meta reports two very different numbers.
- CTR (All): every click, including post expansions, profile taps, and reactions. Median around 1.81%.
- Link CTR: only clicks that reach your destination. Median around 1.03%, and the cleaner metric for traffic goals.
- Highest verticals: Shopping (4.13%), Travel (2.76%), Sports & Recreation (2.60%).
- Lowest: Automotive repair (0.80%), Physicians (0.83%), Finance & Insurance (0.98%).
- A strong CTR shows creative and targeting are resonating, but it does not prove a campaign is healthy. Triple Whale flagged Travel Accessories, where CTR rose 17% while conversion rate fell 17%. Validate CTR against conversion rate and cost per result before you scale.
A good Facebook CPM in 2026 sits in the $8 to $15 range, with an ecommerce median around $13.48. CPM measures what you pay to reach 1,000 people, so it is the clearest read on how competitive your target audience is.
- By placement: Facebook around $7.47, Instagram $6.25 to $7.68.
- By source: ecommerce panels report about $13.48, while blended placement data runs lower, which is why reports disagree.
- Seasonality: Black Friday and Cyber Monday commonly run two to three times the annual baseline.
- CPM rose roughly 20% across 2025 as more advertisers crowded the same auction, alongside an 8.3% rise in conversion rates. If your CPM runs two to three times the median outside Q4, the usual causes are narrow targeting, audience overlap, or low ad relevance. Plan holiday budgets against the seasonal peak, not the annual median.
A good Facebook ROAS is whatever clears your break-even, which equals 1 divided by your contribution margin, not a universal 4x. The ecommerce median is 1.93x, but the same number means profit for one brand and losses for another.
- 25% margin: break-even 4.0x. 30%: 3.33x. 40%: 2.5x. 60%: 1.67x, so the 1.93x median is already profitable.
- Retargeting delivers about 71% higher ROAS than prospecting, so a blended average hides which engine is working.
- Platform-reported ROAS over-states true contribution by 20% to 50% versus incrementality testing, so the 1.93x in Ads Manager is not the 1.93x your finance team would measure.
- Calculate your break-even before comparing to any benchmark, and judge the account on blended marketing efficiency and new-customer acquisition cost, not platform ROAS alone.
Yes. In Q1 2026, Meta's average price per ad climbed 12% worldwide and 14% in the US and Canada year over year, even as ad impressions grew 13% in that region.
- Why: more advertisers competing in the same auction, plus Meta's AI extracting more revenue per impression.
- Not why: the audience is not shrinking; family daily active people grew only about 4%, to 3.56 billion.
- Scale: Q1 2026 advertising revenue reached $55.0B, up 33% year over year.
- This is a monetisation story, not a traffic story, which structurally favours large incumbents with deep creative libraries. To hold your cost per result, the levers are sharper creative testing, broader targeting that feeds the algorithm signal, and complete conversion tracking. Note that Meta reports average price per ad, not CPC.
Most small businesses spend a few hundred dollars to about $1,500 a month on Facebook ads, with a common figure near $1,000. The right number depends on your goal, your industry's click and lead costs, and how many campaigns you need to test.
- Proper test budget: roughly $1,500 to $2,800 a month, enough to fund one or two ad sets through the learning phase.
- Why not less: spreading a small budget across many ad sets is the top reason a test never stabilises.
- Cost drivers: your vertical sets the baseline, and Q4 pushes everyone higher.
- A more reliable way to budget is to work backwards. Take your industry's cost per lead or acquisition from the tables above, decide how many leads or sales you need each month, and multiply. Give each campaign enough budget to exit Meta's learning phase, usually at least 50 conversions per week per ad set, before you judge results.
A Facebook CPA above the benchmark is almost always one of six causes, and the most common and most overlooked is missing conversion tracking.
- High-cost vertical: finance, legal, and dental sit at the top of every cost table.
- Q4 seasonal spike: November CPMs run two to three times the annual baseline.
- Targeting too narrow: small audiences pay an auction premium and starve the algorithm of signal.
- Fatigued creative: when frequency climbs past about 3.0 and CTR falls, the hook is stale.
- Low ad relevance: Meta prices each impression partly on ad quality, raising your effective cost.
- Missing tracking: if conversions are not sent back, CPA only looks high because Meta is not counting every order. Check store revenue against Ads Manager first; if sales held steady while reported CPA rose, the problem is measurement, and the answer is server-side tracking rather than budget cuts.
Your Facebook numbers do not match your sales because platform reporting is incomplete, the single most common advertiser complaint of 2026.
- Hidden conversions: about 75% of iOS users opt out of tracking, and iOS strips click identifiers, so the pixel never sees those conversions.
- Over-crediting: last-click attribution over-credits the conversions Meta can see while missing the ones it cannot.
- Window changes: on 12 January 2026 Meta removed its 7-day and 28-day view-through windows, cutting reported conversions further.
- Reconcile Ads Manager against your actual store revenue over the same dates, then add server-side tracking through the Conversions API, which recovers 20% to 40% of the conversions the browser pixel misses. Judge the account on blended marketing efficiency and new-customer acquisition cost rather than last-click ROAS.
Yes, but by roughly 12% to 22%, not the 32% figure some posts headline.
- Meta's own tests: about 12% lower cost per purchase and 17% more purchases per dollar versus manual campaigns.
- Third-party data: about 22% higher ROAS (4.52x versus 3.70x manual).
- Best fit: accounts spending over $10,000 a month, where the algorithm has enough conversion volume to learn.
- The widely quoted 32% lower CPA is real but mislabelled: Meta cites it for cost per incremental conversion when Advantage+ runs alongside manual campaigns. For lead campaigns, add quality controls and watch closed revenue, not just lead count, because Advantage+ can lower cost per lead while raising the share of low-intent form-fills.
Facebook and Instagram have similar CPMs, around $6 to $8, but Instagram carries a higher CPC because users engage visually and click less often.
- Facebook: CPM around $7.47, CPC around $1.06.
- Instagram Feed: CPC up to $3.35, reflecting premium audiences and lower click rates.
- Instagram Stories: the most cost-efficient placement for clicks, about 45% cheaper than Feed.
- The right choice depends on your goal. For top-of-funnel awareness and cheap impressions, Instagram Stories and Reels are strong; for direct response where click cost matters, Facebook Feed often wins. In practice most accounts run Advantage+ placements and let Meta spread spend where each conversion is cheapest. Compare placements on cost per result, not CPM or CPC alone.
Yes, as a low-cost test for brands already running Meta campaigns. Threads CPMs run 30% to 40% below Instagram, making it the cheapest new inventory in the Meta ecosystem.
- Reach: more than 400 million monthly active users by early 2026.
- Availability: ads opened to all advertisers globally on 21 January 2026.
- Format: text-first, so it rewards conversational, native-feeling creative over polished product shots.
- Test through Advantage+ placement distribution, which serves your existing campaigns on Threads without building anything separate. Keep expectations measured: reporting is less mature and volume is smaller. Use it to capture cheap reach while costs are low, not as a primary conversion channel.
Methodology and sources
This report aggregates published benchmark data from named third-party datasets and Meta's own filings. We do not run a proprietary ad-spend panel, so we cite each provider directly rather than presenting their numbers as our own. Where sources disagree, we show the range and explain why, since ecommerce, lead generation, and blended datasets measure different slices of the market. All figures are medians unless stated, and all are dated. Last reviewed 27 June 2026.
- WordStream / LocaliQ. "Facebook Ads Benchmarks 2025." 1,180 US campaigns, April 2024 to June 2025. Updated 15 September 2025.
- Triple Whale. "Facebook Ad Benchmarks by Industry." ~35,000 ecommerce brands, full-year 2025. Updated 25 February 2026.
- Meta Platforms. "Meta Reports First Quarter 2026 Results." Reported 29 April 2026.
- WebFX. "Meta Marketing Benchmarks for Facebook and Instagram in 2026."
- Databox. "Facebook Ads Benchmarks." Cross-company medians, updated 2 March 2026.
- Superads. Global CPC and CPM medians, $3 billion in ad spend tracked, January 2025 to January 2026.
- eMarketer. Global ad revenue forecast, April 2026.
- Meta "Andromeda" delivery update, March 2026: aggregated 2026 practitioner reporting and public advertiser discussions.
Spotted a figure that has moved since publication? Benchmarks change with each quarterly report. We review this page every quarter against the source updates above.